
Everything you need, end to end.
Most businesses sit on more data than they use. We turn yours into answers someone can act on this week.
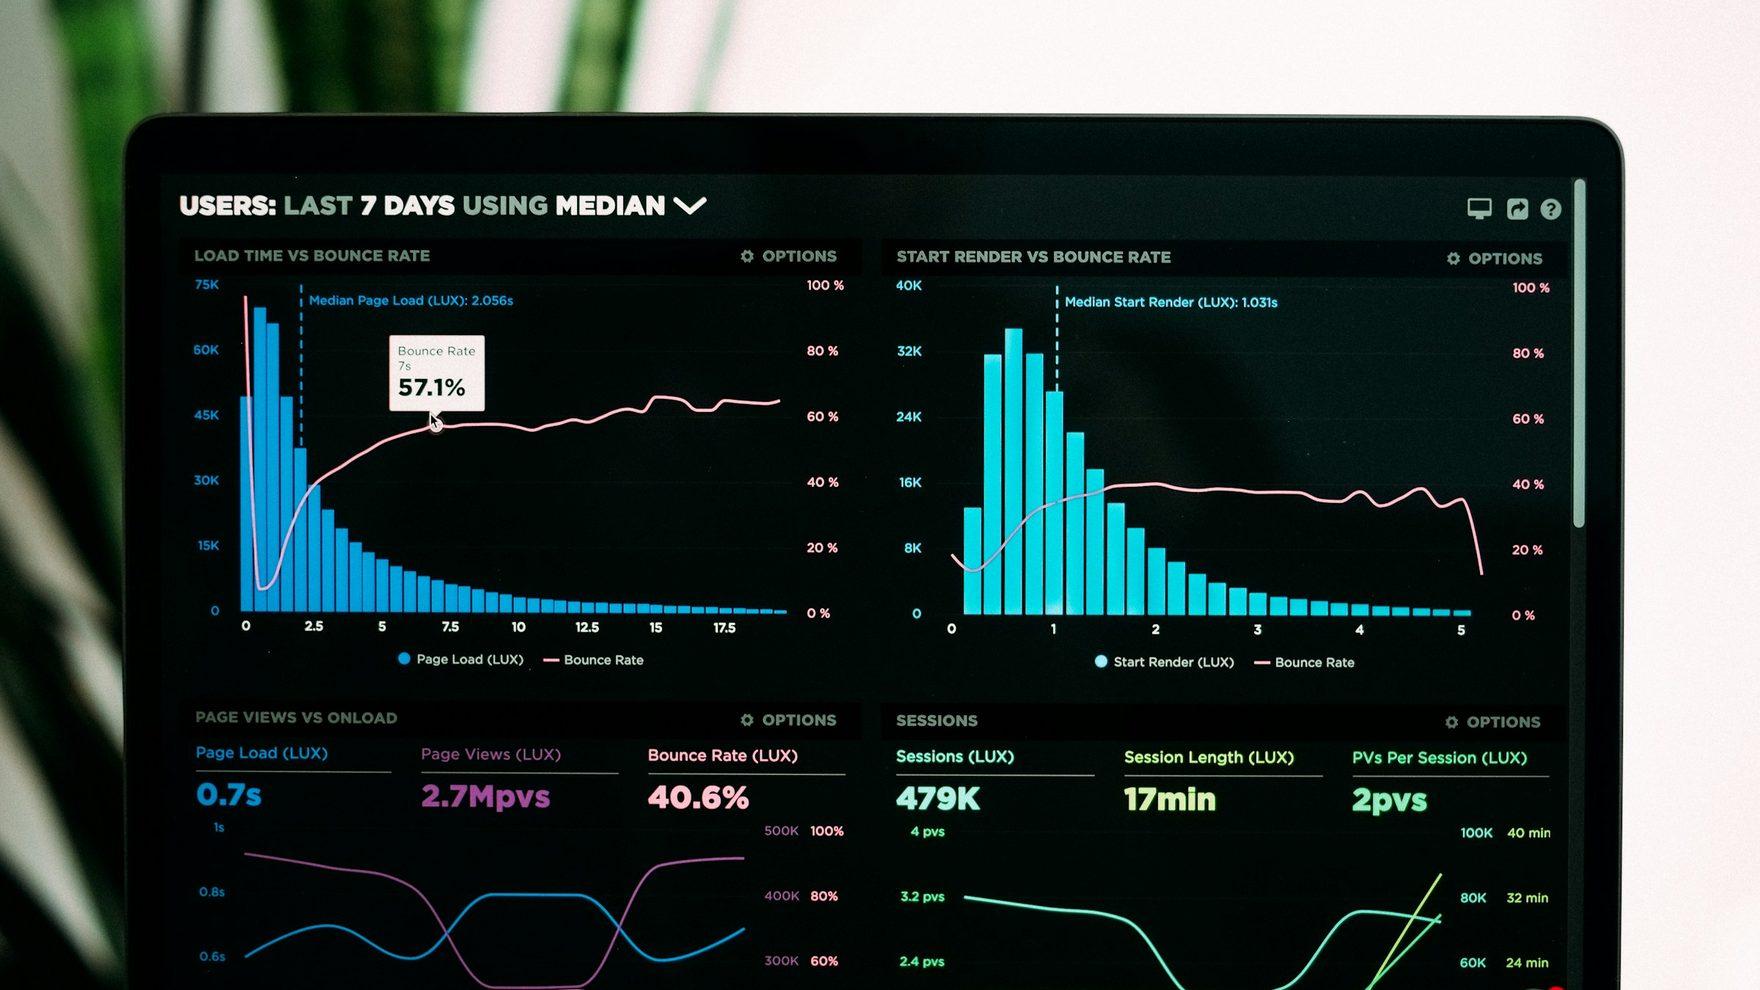
Photography here illustrates the settings this work runs in. The interfaces shown are representative — yours is designed around your brand and your data.
Dashboards that answer questions
Self-updating reporting that surfaces trends, cohorts and outliers — so the Monday meeting starts from the same numbers instead of four different spreadsheets.

Models in production, not notebooks
Forecasting, churn scoring, segmentation and recommendations deployed behind real pipelines and monitored for drift — because a model nobody can call is just a slide.

Clean inputs before clever maths
Pipelines, validation and warehousing first. Most failed data projects fail here — we fix the plumbing so everything built on top of it can be trusted.
Shipped, live, and yours to inspect.
Real systems we built in this space. Every one of them is online right now — open them.

What people come to us for.
Demand forecasting
A model predicting weekly demand so a retailer could stock smarter and cut both stockouts and waste.
Churn prediction
Scored accounts by churn risk and fed the list to the success team before customers slipped away.